Jamming Attack Validation Database
Download
- ZIP (~70 GB): Download
- SHA-256:
ad6bb6f7d26337c92c56e8f3a2e6e6d11aaec44218a31f7883fe6912379c23b6
Overview
This repository contains a comprehensive dataset for analyzing deceptive jamming attacks on On-Off Keying (OOK) modulated signals in the 915 MHz ISM band. The dataset was generated using USRP B210 Software Defined Radios (SDRs) and includes received signal amplitude and Received Signal Strength Indicator (RSSI) measurements across various Jammer-to-Signal Ratio (JSR) conditions.
Research Context
Motivation
Wireless communication systems operating in unlicensed ISM bands are vulnerable to jamming attacks. Understanding the impact of deceptive jamming on OOK-modulated signals is critical for:
- Developing robust anti-jamming techniques
- Characterizing signal degradation under interference
- Designing resilient IoT and sensor network protocols
- Establishing baseline metrics for jamming detection algorithms
Signal Characteristics
- Modulation Scheme: On-Off Keying (OOK)
- Operating Frequency: 915 MHz (ISM Band)
- Data Rate: 0.1 kbps (100 bps)
- Frame Structure: 64-bit frames consisting of:
- 32-bit Preamble:
[1 0 1 0]repeated 8 times - 8-bit Start Frame Delimiter (SFD):
[1 1 1 0 0 1 0 0] - 8-bit PHY Header:
[0 0 0 0 0 1 1 0] - 16-bit Frame Control:
[0 1 0 0 0 0 0 0 0 0 0 0 0 0 0 0]
- 32-bit Preamble:
- Frame Duration: 640 ms (0.64 seconds)
- Bit Duration: 10 ms per bit
Experimental Setup
Hardware Configuration
Transmitter (Tx)
- Platform: USRP B210 SDR
- Serial Number: 32711A0
- Dual-channel transmission:
- Channel 1: OOK-modulated signal
- Channel 2: Continuous sine wave jammer
- Center Frequency: 915 MHz
- Master Clock Rate: 30 MHz
- Sample Rate: 5 MHz
Receiver (Rx)
- Platform: USRP B210 SDR
- Serial Number: 328B000
- Center Frequency: 915 MHz
- Master Clock Rate: 30 MHz
- Sample Rate: 5 MHz
- Receiver Gain: 40 dB (fixed)
Signal Generation
OOK Signal (Channel 1)
- Baseband carrier frequency: 100 kHz
- Binary modulation: carrier ON for bit ‘1’, OFF for bit ‘0’
- Frame-based transmission with IEEE 802.15.4-inspired structure
Jammer Signal (Channel 2)
- Continuous complex exponential:
exp(j*2π*f_offset*t) - Frequency offset from baseband: 4.22 kHz
- Activation timing: Configurable via delta parameter (δ)
- Formula:
jammer_activation_time = 0.1 + (1 - δ) × (0.64 - 0.1)seconds - Where:
- Initial delay: 100 ms (0.1 s)
- Total frame duration: 640 ms (0.64 s)
- δ ∈ [0, 1]
- δ = 0: Jammer activates at 640 ms (end of frame)
- δ = 0.5: Jammer activates at 370 ms (mid-frame)
- δ = 1: Jammer activates at 100 ms (immediately after initial delay)
- Formula:
JSR Calibration and Correction Methodology
Discovery of Power Imbalance
During initial testing, a significant power imbalance between the two transmission channels was discovered through systematic isolation testing.
Calibration Process
Step 1: Isolation Testing
Two separate tests were conducted to measure individual channel performance:
-
Transmitter-Only Test (Jammer OFF):
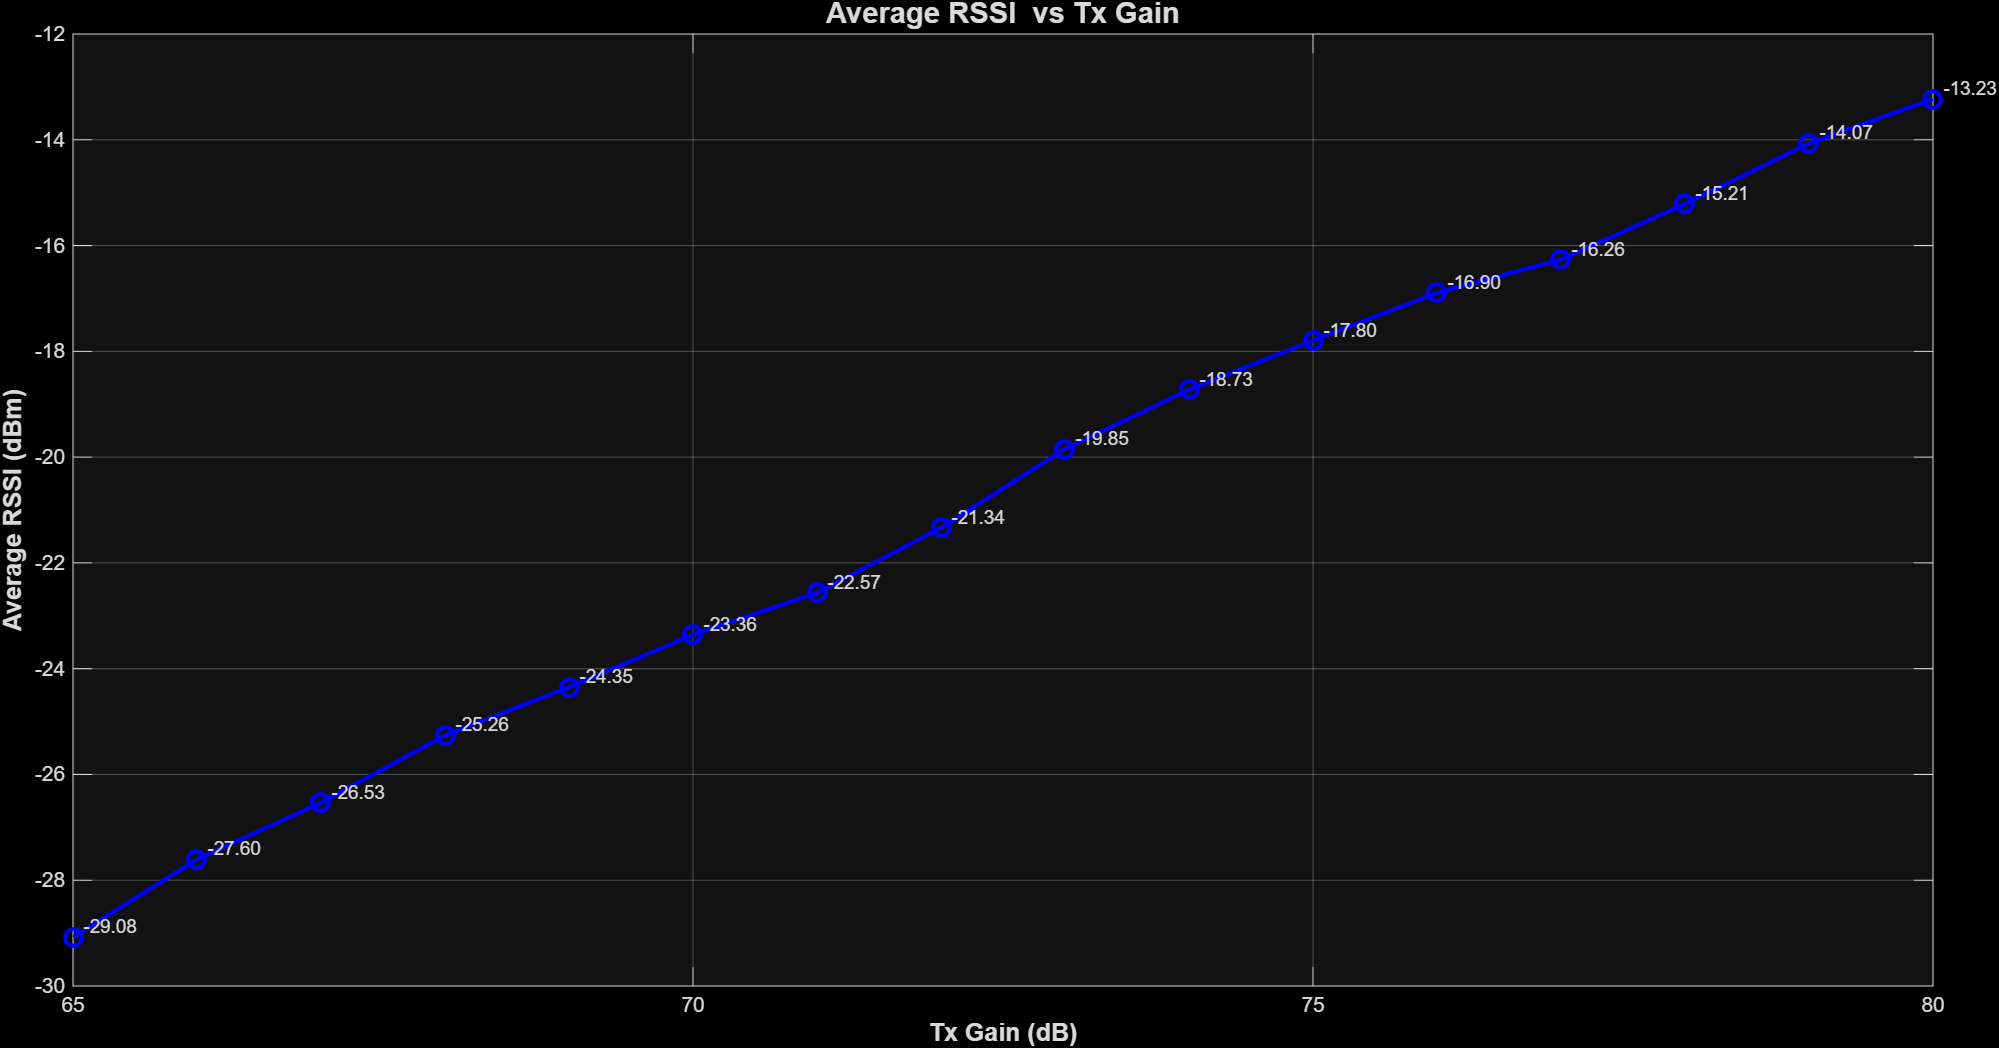
- Channel 1 (OOK signal): Gain set to reference level (e.g., 70 dB)
- Channel 2 (Jammer): Disabled or set to minimum gain
- Measured average received power:
P_signal - Power Mapping:
-
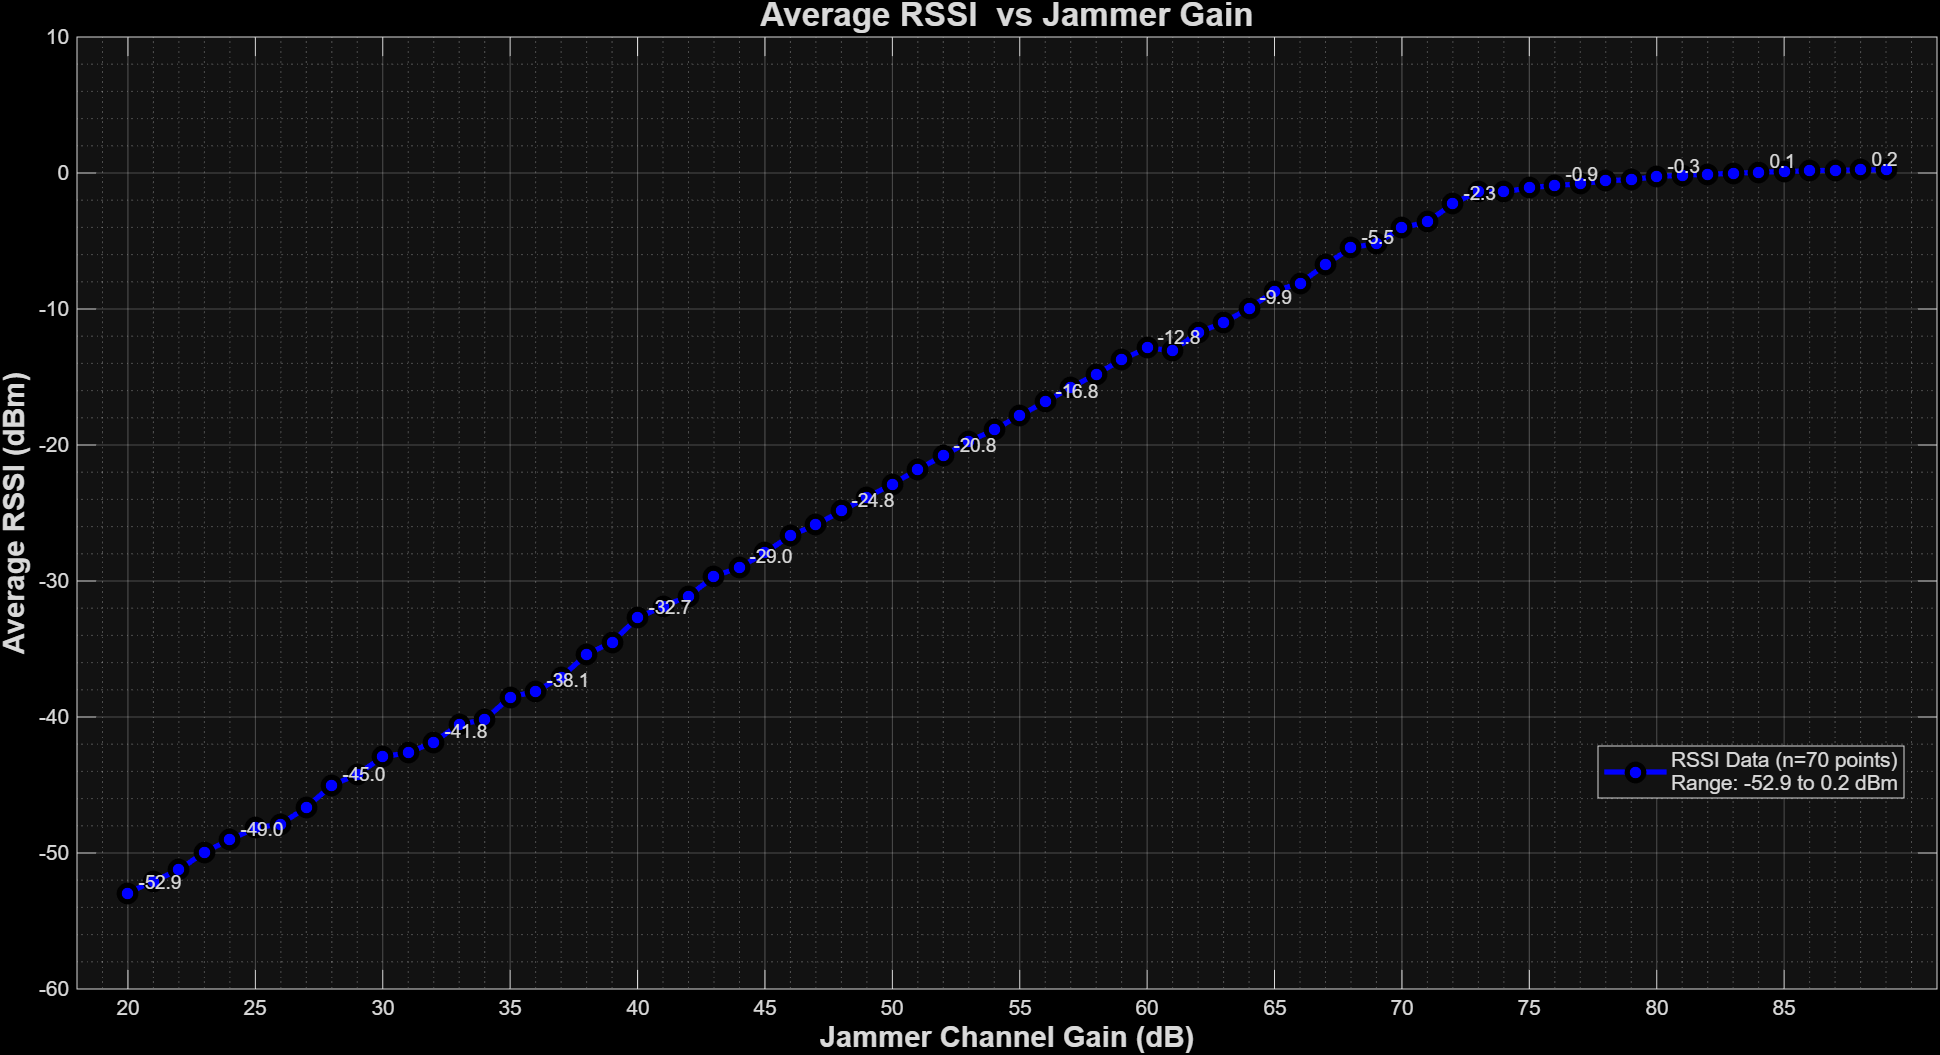
Jammer-Only Test (Transmitter OFF):
- Channel 1 (OOK signal): Disabled or set to minimum gain
- Channel 2 (Jammer): Gain set to same reference level (e.g., 70 dB)
- Measured average received power:
P_jammer - Power Mapping:
Step 2: Power Difference Measurement at Nominal JSR = 0 dB
When both channels were configured with identical transmit gains (Nominal JSR = 0 dB):
Expected: P_jammer - P_signal = 0 dB (equal power)
Observed: P_jammer - P_signal = +18 dB (jammer 18 dB stronger!)
Key Finding: At nominal JSR = 0 dB, the jammer channel was actually 18 dB stronger than the signal channel at the receiver.
Root Causes of Power Imbalance
The 18 dB offset can be attributed to several factors:
-
Hardware Asymmetries:
- Different power amplifier characteristics between Tx channels
- Antenna gain differences or cable losses
- RF path variations in the USRP B210
-
Signal Characteristics:
- OOK signal is time-varying (ON/OFF keying) vs. continuous jammer tone
- Average power of OOK signal is lower than peak power
- Duty cycle effects in OOK modulation
-
Frequency-Dependent Effects:
- Slight frequency offset (4.22 kHz) may cause different filtering/amplification
- Baseband processing differences for different signal types
Correction Strategy
To achieve accurate JSR values, a pre-compensation approach was implemented at the transmitter:
Correction Formula:
Transmit_JSR = Desired_JSR - 18 dBExample:
-
To achieve actual JSR = 0 dB (equal received power):
- Transmitter configured with nominal JSR = -18 dB
-
To achieve actual JSR = +24 dB (jammer 24 dB stronger):
- Transmitter configured with nominal JSR = +6 dB
File Naming Convention: The “_corrected” Suffix
All dataset files include the _corrected suffix to indicate that:
- The JSR values in filenames represent actual received JSR (post-correction)
- The transmitter was pre-compensated by -18 dB during data collection
- Power measurements were validated through isolation testing
Example File Names:
RSSI_JSR=0_jammer_to_signal_20251009184512_corrected.csv
  → Actual received JSR = 0 dB
  → Equal power between signal and jammer at receiver

RSSI_JSR=24_jammer_to_signal_20251018092202_corrected.csv
  → Actual received JSR = 24 dB
  → Jammer is 24 dB stronger than signal at receiver

RSSI_JSR=-30_jammer_to_signal_20251016034156_corrected.csv
  → Actual received JSR = -30 dB
  → Signal is 30 dB stronger than jammer at receiver
Verification and Validation
Post-Correction Verification:
After applying the -18 dB pre-compensation, the corrected JSR values were validated:
-
RSSI Comparison:
- At corrected JSR = 0 dB:
RSSI_jammer ≈ RSSI_signal(confirmed equal power) - At corrected JSR = +10 dB:
RSSI_jammer ≈ RSSI_signal + 10 dB(confirmed 10 dB difference)
- At corrected JSR = 0 dB:
-
Consistency Across Range:
- Linear relationship between corrected JSR and measured power difference
- Verified across entire JSR range (-30 dB to +24 dB)
-
Repeatability:
- Multiple measurements at same JSR showed consistent RSSI values
- Standard deviation < 1 dB across repeated trials
JSR Range in Dataset
Corrected JSR Range: -30 dB to +24 dB (55 values in 1 dB steps)
Physical Interpretation:
- JSR < 0 dB: Signal dominates, jammer is weaker
- JSR = 0 dB: Equal received power (validated through calibration)
- JSR > 0 dB: Jammer dominates, signal is weaker
- JSR > 20 dB: Severe jamming, signal barely detectable
Importance of Correction
The _corrected designation is critical for:
- Accurate Analysis: Ensures researchers use true received power ratios
- Reproducibility: Other researchers can replicate conditions knowing actual JSR values
- Comparison: Enables fair comparison with literature and other datasets
- Physical Validity: JSR = 0 dB truly represents equal-power scenario, not an 18 dB imbalance
Dataset Structure
File Naming Convention
All dataset files follow the naming pattern:
[TYPE]_JSR=[VALUE]_[EXPERIMENT_NAME]_[TIMESTAMP]_corrected.[EXTENSION]Where:
[TYPE]: Data type (parameters, AMPLITUDE, RSSI, or ALL)[VALUE]: Actual received JSR value in dB (after -18 dB correction)[EXPERIMENT_NAME]: User-defined experiment identifier[TIMESTAMP]: Generation timestamp (YYYYMMDDHHMMSS format)_corrected: Indicates JSR values represent actual received power ratios[EXTENSION]: File format (.txt, .csv, or .mat)
File Types
1. Parameters File (.txt)
Example: parameters_JSR=24_corrected.txt
Contains experimental configuration and metadata:
- Experiment name and timestamp
- Radio parameters (frequencies, sample rates, clock rates)
- Modulation parameters (bit rate, frame structure)
- Gain configurations for all test cases
- Actual received JSR value
- RSSI calculation interval (0.1 ms)
- Channel gain combinations tested
Format: Human-readable text with key-value pairs
Sample Content:
Experiment Name: jammer_to_signal
Receiver Gain: 40.0 dB
JSR: 24.0 dB (Actual Received)
Sample Rate: 5000000 Hz
Bit Rate: 100.0 bps
Samples per Bit: 50000
Bit Duration: 0.010 seconds (10.0 ms)
RSSI Interval: 0.0001 seconds (0.10 ms)
Total Duration: 0.640 seconds
Total Iterations: 16
2. Amplitude CSV File (.csv)
Example: AMPLITUDE_JSR=24_jammer_to_signal_20251018092202_corrected.csv
Contains time-series data of received signal amplitude:
- Column 1:
Time_s- Time in seconds (sample-level resolution) - Subsequent Columns: Amplitude values for each channel gain combination
- Column header format:
ch1_[GAIN1]_ch2_[GAIN2] - GAIN1: Channel 1 (OOK signal) transmit gain in dB
- GAIN2: Channel 2 (jammer) transmit gain in dB
- Column header format:
Dimensions:
- Rows: 3,200,000 samples (0.64 seconds × 5 MHz sample rate)
- Columns: 1 time column + N gain combinations (varies by JSR, typically 13-16)
Data Characteristics:
- Sampling rate: 5 MHz (200 ns per sample)
- Total duration per measurement: 640 ms
- Data type: Floating-point amplitude values (absolute value of complex signal)
- Values represent instantaneous signal envelope
Example Header (for JSR = 24 dB):
Time_s,ch1_65_ch2_71,ch1_66_ch2_72,ch1_67_ch2_73,...,ch1_80_ch2_86Example Header (for JSR = -30 dB):
Time_s,ch1_68_ch2_20,ch1_69_ch2_21,ch1_70_ch2_22,...,ch1_80_ch2_323. RSSI CSV File (.csv)
Example: RSSI_JSR=24_jammer_to_signal_20251018092202_corrected.csv
Contains time-series RSSI (Received Signal Strength Indicator) measurements:
- Column 1:
Time_s- Time in seconds (interval centers) - Subsequent Columns: RSSI values in dBm for each channel gain combination
- Column header format:
ch1_[GAIN1]_ch2_[GAIN2]
- Column header format:
RSSI Calculation Method:
% For each 0.1 ms interval (500 samples):
signal_power = mean(abs(interval_samples).^2)
rssi_dBm = 10 * log10(signal_power)Dimensions:
- Rows: 6,400 intervals (640 ms / 0.1 ms per interval)
- Columns: 1 time column + N gain combinations (varies by JSR, typically 13-16)
- Temporal resolution: 0.1 ms (100 μs)
Data Characteristics:
- RSSI update rate: 10 kHz (every 0.1 ms)
- Samples per RSSI calculation: 500
- Provides fine-grained power variation tracking
- Units: dBm (decibels relative to 1 milliwatt)
Example Header (for JSR = 24 dB):
Time_s,ch1_65_ch2_71,ch1_66_ch2_72,ch1_67_ch2_73,...,ch1_80_ch2_864. Complete MATLAB Data File (.mat)
Example: ALL_JSR=24_jammer_to_signal_20251018092202_corrected.mat
Comprehensive MATLAB structure containing all experimental data and metadata:
Structure Fields:
% For each gain combination (combo_id: 'ch1_XX_ch2_YY'):
all_data.(combo_id).amplitude_timeseries  % MATLAB timeseries object
all_data.(combo_id).rssi_timeseries       % MATLAB timeseries object
all_data.(combo_id).raw_signal            % Complex baseband signal (I+jQ)
all_data.(combo_id).rssi_values_array     % Raw RSSI array (6400 values)
all_data.(combo_id).ch1_gain              % Channel 1 gain (dB)
all_data.(combo_id).ch2_gain              % Channel 2 gain (dB)
all_data.(combo_id).rx_gain               % Receiver gain (dB, fixed at 40)
all_data.(combo_id).JSR                   % Actual received JSR (dB)
all_data.(combo_id).reception_time        % Signal capture time (s)
all_data.(combo_id).rssi_calc_time        % RSSI processing time (s)
all_data.(combo_id).total_iter_time       % Total iteration time (s)
all_data.(combo_id).timestamp             % Measurement timestamp (datetime)
all_data.(combo_id).num_rssi_intervals    % Number of RSSI intervals (6400)

% Global parameters structure:
params.experiment_name                     % User-defined experiment name
params.samp_rate                          % 5e6 Hz
params.master_clock_rate                  % 30e6 Hz
params.carrier_freq                       % 915e6 Hz (RF carrier)
params.carrier_freq_baseband              % 100e3 Hz (baseband carrier)
params.channel2_offset                    % 4.22e3 Hz (jammer offset)
params.tx_duration                        % 0.64 s (frame duration)
params.bit_rate                           % 100 bps
params.samples_per_bit                    % 50,000
params.bit_duration                       % 0.01 s (10 ms)
params.rssi_interval                      % 0.0001 s (0.1 ms)
params.samples_per_rssi                   % 500
params.rx_gain                            % 40 dB (fixed)
params.JSR                                % Actual received JSR value (dB)
params.start_time                         % Experiment start datetime
File Format: MATLAB v7.3 (HDF5-based) for large dataset support
Timeseries Objects: Both amplitude and RSSI are stored as MATLAB timeseries with proper time units (seconds), enabling direct use of MATLAB’s time-series analysis functions.
Experimental Scenarios
JSR Range Tested
The dataset covers JSR values from -30 dB to +24 dB, spanning:
- Weak Jamming (JSR < 0 dB): Signal stronger than jammer
- Equal Power (JSR ≈ 0 dB): Signal and jammer at comparable power levels (validated)
- Strong Jamming (JSR > 0 dB): Jammer stronger than signal
- Severe Jamming (JSR > 20 dB): Jammer dominates the received signal
Gain Combinations
Channel 1 (OOK Signal) Gain Range: 65 to 80 dB (1 dB steps)
- Nominal range: 16 gain levels
Channel 2 (Jammer) Gain Range: 20 to 89 dB (hardware limitation)
- Configured with -18 dB pre-compensation to achieve target JSR
Important Hardware Constraint: Due to the USRP B210 Channel 2 gain limits (20-89 dB), not all Channel 1 gain values are available for lower JSR values. The number of valid gain combinations varies with JSR.
General Formula:
Channel_2_Gain = Channel_1_Gain + JSR_desired - 18Constraint:
20 ≤ Channel_2_Gain ≤ 89Gain Combination Examples
Example for JSR = 24 dB (actual received):
- Channel 1 = 65 dB → Channel 2 = 71 dB ✓ Valid
- Channel 1 = 70 dB → Channel 2 = 76 dB ✓ Valid
- Channel 1 = 80 dB → Channel 2 = 86 dB ✓ Valid
- All 16 gain combinations available (Channel 2 range: 71-86 dB)
Example for JSR = 0 dB (actual received, equal power):
- Channel 1 = 65 dB → Channel 2 = 47 dB ✓ Valid
- Channel 1 = 70 dB → Channel 2 = 52 dB ✓ Valid
- Channel 1 = 80 dB → Channel 2 = 62 dB ✓ Valid
- All 16 gain combinations available (Channel 2 range: 47-62 dB)
Example for JSR = -10 dB (actual received, signal stronger):
- Channel 1 = 65 dB → Channel 2 = 37 dB ✓ Valid
- Channel 1 = 70 dB → Channel 2 = 42 dB ✓ Valid
- Channel 1 = 80 dB → Channel 2 = 52 dB ✓ Valid
- All 16 gain combinations available (Channel 2 range: 37-52 dB)
Example for JSR = -20 dB (actual received, signal much stronger):
- Channel 1 = 65 dB → Channel 2 = 27 dB ✓ Valid
- Channel 1 = 70 dB → Channel 2 = 32 dB ✓ Valid
- Channel 1 = 80 dB → Channel 2 = 42 dB ✓ Valid
- All 16 gain combinations available (Channel 2 range: 27-42 dB)
Example for JSR = -27 dB (actual received):
- Channel 1 = 65 dB → Channel 2 = 20 dB ✓ Valid (at minimum)
- Channel 1 = 66 dB → Channel 2 = 21 dB ✓ Valid
- Channel 1 = 80 dB → Channel 2 = 35 dB ✓ Valid
- All 16 gain combinations available (Channel 2 range: 20-35 dB)
Example for JSR = -30 dB (actual received, signal much stronger):
- Channel 1 = 65 dB → Channel 2 = 17 dB ✗ Invalid (below 20 dB limit)
- Channel 1 = 66 dB → Channel 2 = 18 dB ✗ Invalid
- Channel 1 = 67 dB → Channel 2 = 19 dB ✗ Invalid
- Channel 1 = 68 dB → Channel 2 = 20 dB ✓ Valid (at minimum)
- Channel 1 = 69 dB → Channel 2 = 21 dB ✓ Valid
- Channel 1 = 80 dB → Channel 2 = 32 dB ✓ Valid
- Only 13 gain combinations available (Channel 1: 68-80 dB, Channel 2: 20-32 dB)
Available Gain Combinations per JSR
The table below shows the number of valid gain combinations for different JSR values:
| Actual JSR (dB) | Min Ch2 Gain (dB) | Max Ch2 Gain (dB) | Valid Ch1 Range (dB) | Number of Combinations |
|---|---|---|---|---|
| +24 | 71 | 86 | 65-80 (all) | 16 |
| +20 | 67 | 82 | 65-80 (all) | 16 |
| +10 | 57 | 72 | 65-80 (all) | 16 |
| 0 | 47 | 62 | 65-80 (all) | 16 |
| -10 | 37 | 52 | 65-80 (all) | 16 |
| -20 | 27 | 42 | 65-80 (all) | 16 |
| -27 | 20 | 35 | 65-80 (all) | 16 |
| -28 | 19 | 34 | 66-80 | 15 |
| -29 | 18 | 33 | 67-80 | 14 |
| -30 | 17 | 32 | 68-80 | 13 |
Key Observations:
- JSR ≥ -27 dB: All 16 gain combinations available
- JSR < -27 dB: Number of combinations decreases as JSR becomes more negative
- Lower JSR datasets contain fewer gain combinations due to Channel 2 minimum gain constraint (20 dB)
Data Interpretation Note: When comparing datasets across different JSR values, be aware that lower JSR configurations (JSR < -27 dB) have fewer gain combinations. Statistical analyses should account for this variable sample size.
Column Header Variations: In CSV files for low JSR values (e.g., JSR = -30 dB), you will see column headers starting from higher Channel 1 gains:
Time_s,ch1_68_ch2_20,ch1_69_ch2_21,...,ch1_80_ch2_32Instead of the typical:
Time_s,ch1_65_ch2_XX,ch1_66_ch2_XX,...,ch1_80_ch2_XXTiming Synchronization and Observed Delays
Clock Synchronization Characteristics
Due to the independent operation of transmitter and receiver SDRs without an external reference clock or hardware trigger synchronization, a systematic timing offset is observed in all measurements.
Observed Behavior:
- Expected start time: 0 ms
- Actual observed start time: Variable (typically 10-50 ms depending on JSR)
- Offset magnitude: Varies between different JSR configurations (e.g., 10 ms for some JSR values, 40 ms for others, up to 50 ms for yet others)
- Consistency: Within each JSR dataset, this delay is constant across all gain combinations and iterations
- JSR-specific: Each JSR value has its own characteristic timing offset that remains consistent throughout that specific measurement campaign
Impact on Data Analysis
Important Considerations:
Does NOT affect relative timing analysis:
- All events (preamble, SFD, data bits, jammer activation) maintain correct relative timing
- Bit transitions occur at proper 10 ms intervals after the offset
- Jammer activation timing relative to frame start is preserved
Does NOT affect RSSI measurements:
- RSSI values are calculated correctly regardless of absolute time offset
- Signal power measurements remain valid
- JSR characterization is unaffected
Technical Specifications
Timing Characteristics
| Parameter | Value | Notes |
|---|---|---|
| Frame Duration | 640 ms | 64 bits × 10 ms/bit |
| Bit Duration | 10 ms | 100 bps bit rate |
| Sample Period | 0.2 μs | 5 MHz sampling rate |
| RSSI Update Interval | 0.1 ms | 10 kHz RSSI rate |
| Samples per Bit | 50,000 | High oversampling ratio |
| Samples per RSSI | 500 | Fine-grained power averaging |
| Timing Offset | 10-50 ms | Systematic delay, varies by JSR but constant within each JSR |
Frequency Plan
| Component | Frequency | Notes |
|---|---|---|
| RF Center | 915 MHz | ISM band center frequency |
| OOK Baseband Carrier | 100 kHz | Offset from DC |
| Jammer Offset | 4.22 kHz | Relative to baseband carrier |
| Master Clock | 30 MHz | SDR internal clock |
| Sample Rate | 5 MHz | ADC/DAC rate |
Data Volume
Per JSR Configuration:
- Amplitude CSV: ~450 MB (16 columns × 3.2M rows for high JSR)
- RSSI CSV: ~1000 KB (16 columns × 6.4K rows for high JSR)
- Complete MAT file: ~1200 MB (includes raw complex samples)
- Parameters TXT: ~4 KB
Full Dataset (JSR = -30 to +24 dB, 55 configurations):
- Total storage: ~70 GB (compressed)
- Total measurements: ~877 individual captures (55 JSR values, 13-16 gain combinations each)
Known Limitations and Considerations
Hardware Constraints
-
Gain Range Limitations:
- Channel 2 (jammer) gain constrained to 20-89 dB
- Results in fewer gain combinations for JSR < -27 dB
- High JSR values (>20 dB) may approach SDR power amplifier saturation
- Receiver automatic gain control (AGC) is disabled (fixed 40 dB gain)
- Extreme gain settings may exhibit non-linear behavior
-
Frequency Stability:
- No external reference clock; rely on USRP internal TCXO
- Potential for ~1 ppm frequency drift over long measurements
- Phase coherence between channels maintained during each 640 ms frame
-
Channel Isolation:
- Tx/Rx leakage may affect measurements at extreme power levels
- Measurements conducted with separate antennas and spatial isolation
- Some inter-channel coupling possible at very high transmit gains
Signal Processing Considerations
-
RSSI Calculation Window:
- 0.1 ms intervals (500 samples) provide fine temporal resolution
- May capture fast fading effects and transient phenomena
- For bit-level analysis, consider averaging over 10 ms windows (100 RSSI values)
- Sub-bit resolution enables detailed transition analysis
-
Phase Information:
- Raw complex samples (
raw_signalin MAT files) contain I/Q phase information - OOK modulation does not use phase, but data available for advanced analysis
- Phase may be relevant for interference cancellation techniques
- Raw complex samples (
-
Oversampling Effects:
- 50,000 samples per bit enable detailed waveform analysis
- High sampling may also capture noise and artifacts
- Nyquist considerations: 5 MHz sampling captures up to 2.5 MHz bandwidth
Environmental Factors
- All measurements assumed to be conducted in controlled laboratory environment
- Multipath and external interference not explicitly characterized
- Cable losses and connector attenuation not compensated in dataset
- Temperature and humidity effects not monitored during capture
- Recommend controlled environment for reproducibility
Statistical Limitations
- Single receiver location (no spatial diversity)
- Fixed receiver gain (40 dB) throughout all experiments
- Variable number of transmit gain combinations per JSR (13-16 depending on JSR value)
- Each JSR measured once (no repeated trials for statistical averaging)
File Organization
Directory Structure
dataset/
├── JSR_negative/
│   ├── JSR=-30/
│   │   ├── parameters_JSR=-30_corrected.txt
│   │   ├── AMPLITUDE_JSR=-30_jammer_to_signal_20251016034156_corrected.csv
│   │   ├── RSSI_JSR=-30_jammer_to_signal_20251016034156_corrected.csv
│   │   └── ALL_JSR=-30_jammer_to_signal_20251016034156_corrected.mat
│   ├── JSR=-20/
│   └── ...
├── JSR_zero/
│   └── JSR=0/
│       ├── parameters_JSR=0_corrected.txt
│       ├── AMPLITUDE_JSR=0_jammer_to_signal_20251009184512_corrected.csv
│       ├── RSSI_JSR=0_jammer_to_signal_20251009184512_corrected.csv
│       └── ALL_JSR=0_jammer_to_signal_20251009184512_corrected.mat
├── JSR_positive/
    ├── JSR=10/
    ├── JSR=20/
    ├── JSR=24/
    └── ...
Metadata Extraction
All filenames encode key metadata:
- JSR value: Extract from
JSR=XXpattern (can be negative) - Timestamp: Extract from
YYYYMMDDHHMMSSpattern - Experiment name: Between JSR value and timestamp
Citation
If you use this dataset in your research, please cite:
@dataset{ook_jamming_dataset_2025,
  title={Jamming Attack Validation Database},
  author={[Abhyuday Pandey and Vikram Verma and Shabd Swaroop Kandarpa and Ufuk Muncuk and Aatmesh Shrivastava]},
  year={2025},
  publisher={[Energy Efficient Circuits and Systems Group, Northeastern University, Boston, USA]},
  note={USRP B210 SDR measurements with JSR-corrected power calibration},
  howpublished={\url{[https://coe.northeastern.edu/Research/eecs/downloads/big-dataset/index.html]}},
  keywords={OOK, Jamming, Wireless Security, ISM Band, SDR, Dataset}
}
Version History
- v1.0 (November 2025): Initial release
- JSR range: -30 dB to +24 dB
- 13-16 gain combinations per JSR (variable due to hardware constraints)
- 0.1 ms RSSI temporal resolution
- Calibrated JSR values with 18 dB correction applied
- Systematic timing offset documented (10-50 ms, varies by JSR, constant within each JSR)
Contact and Support
Primary Contact
- Name: Abhyuday Pandey
- Email: btech10174.22@bitmesra.ac.in
- Affiliation: Birla Institute of Technology, Mesra, India
- Name: Vikram Verma
- Email: verma.vikr@northeastern.edu
- Affiliation: Northeastern University, Boston, MA
- Name: Shabd Swaroop Kandarpa
- Email: kandarpa.s@northeastern.edu
- Affiliation: Northeastern University, Boston, MA
- Name: Ufuk Muncuk
- Email: u.muncuk@northeastern.edu
- Affiliation: Northeastern University, Boston, MA
- Name: Aatmesh Shrivastava
- Email: f.aatmesh@northeastern.edu
- Affiliation: Northeastern University, Boston, MA
Acknowledgments
This dataset was generated using:
- Hardware: USRP B210 Software Defined Radio by Ettus Research / National Instruments
- Software: MATLAB R2025b with Communications Toolbox and Communications Toolbox Support Package for USRP Radio
- Environment: [Northeastern University]
Last Updated: November 17, 2025
Dataset Version: 1.0
Status: Active Research Dataset
Total Size: ~70 GB (compressed)
Total Measurements: ~850 individual captures
For questions, collaborations, or feedback, please contact btech10174.22@bitmesra.ac.in